
Backtesting may initially appear complex, yet in essence it is an analytical review of your own market hypothesis. You speculate - based on the probability of X occurring, the price is likely to do Y - and cash that speculation using historic market data without going out of pocket. Backtesting helps reduce the likelihood of early-stage errors and can lower the amount of screen-time otherwise spent monitoring markets. It applies equally to traditional instruments and to newer niches like non-fungible tokens (NFTs), where collections trade on open ledgers and each sale is public.This article outlines a practical framework for readers who already know what a candlestick, a bid-ask spread, and a stop-loss are, but who have never examined a systematic concept with objective data.
Why Backtesting Provides Data-Driven Insight
Improvised trading can incur significant risks. The same may be seen in the history of trade, when trade is analyzed after a loss, which frequently offers rash decisions that are not backed by any statistics. Back testing in demo trading switches that script. There are three commonly cited benefits to using historical data when assessing a strategy, balanced by certain limitations:
- Evidence-based confidence. Win rate, average profit and maximum drawdown can be quantified as opposed to gut feel, yet they remain sample-specific and may not hold in future regimes.
- Freer feedback loops. A month of intraday data can reveal weaknesses early, although simulated fills may differ from live execution.
- Skill isolation. Algorithmic or rules-based testing separates methodology from emotion, but emotional discipline still matters once real capital is at stake.
The CFA Institute content is based on the belief that an investor who justifies style and deploys disciplined procedures to venture into capital is likely to record improved results compared to newly graduated, discretionary traders. The same logic is finding its way into the NFT world: analysts scrape blockchains, label wallets, and test whether metrics such as unique-buyer growth or wash-trading ratios predict floor-price expansion.
Setting Up Your Demo Trading Environment
We require a virtual playground prior to banging a few numbers. This is the area where demo trading comes in. The demo account replicates the quote feed, the types of orders and the computations of risk of a live platform without the psychological pain of losing money. The majority of well-known brokers have time-indefinite demos, which are linked to the same servers as real accounts.
Key considerations for a meaningful environment include precise historical data, identical execution mechanics and the ability to export trade logs. In their absence, all of your statistics will be suspicious. For NFTs, accuracy means pulling every on-chain sale, listing cancellation and royalty payment because the absence of an order book can hide thin liquidity.
Selecting a Suitable Platform
Depending on your asset class to be traded, select the matching software. In the case of a forex strategy test, both MetaTrader and cTrader have provided tick-level data on major pairs since 2010. The TradingView, Sierra Chart, or NinjaTrader are usually relied upon by the equity and futures traders. NFT researchers often lean on Dune Analytics, Flipside, or self-hosted subgraphs to replay trades and compute collection-wide metrics such as mean sale price, floor price, and time-between-sales. When evaluating any platform, practitioners typically examine:
- Data depth. None less than two complete market cycles (bull and bear).
- Order granularity. Support of stop and limit orders and OCO orders in case they are in your system.
- Rule builders or scripting. You, even though you are going to code later, wish you had the choice.
Look at the hidden expenses. Some futures feeds apply exchange charges after a trial period; many traders, therefore, budget such costs alongside commissions and slippage. On-chain queries may rack up API costs once you exceed free-tier limits, and some marketplaces throttle historical endpoints unless you hold their governance token.
Configuring the Initial Paper Balance
On most of them, there is the option of selecting an initial balance. Many users mirror the capital they plan to deploy live so that position sizing remains realistic. An imaginary account of 1 million dollars is tempting you to gamble 1 lot of EUR/USD instead of the 0.1 that you are supposed to gamble with your actual bankroll. Keep in mind: here we want to rehearse and not to fantasize. With NFTs, you might seed your test wallet with the exact number of ETH you intend to commit rather than fantasizing about sweeping an entire blue-chip collection.
Translating a Strategy Into Testable Parameters
The platform does not duplicate your reasoning, and you are not able to audit your performance without specific, objective instructions. Disaggregate the concept into four building blocks:
- Market filter
- Entry signal
- Exit signal
- Risk parameters
Illustrative Entry and Exit Signals (for educational purposes only)
Defining Entry and Exit Signals
Suppose the core premise is: “Go long when the 20-period EMA crosses above the 50-period EMA on the 1-hour chart, if price is above the 200-day SMA.” That contains three distinct states which can be coded or manually monitored:
- Confirm higher-timeframe trend with the 200-day SMA.
- Wait until there is a crossover.
- Trigger entry at the close of the crossover bar.
In the case of exits, either use a symmetrical (EMA cross back down) strategy or a defensive rule, e.g., close when price is below the 50-period EMA. Clear, testable rules limit curve-fitting because each run either satisfies them or not - there is no discretionary wiggle room. An NFT-centric analog may look at on-chain data: enter when daily unique wallets interacting with the collection rise 20% week-over-week while the floor price crosses above its 30-day moving median; exit when daily listings outpace sales twice in a row.
Parameters of Risk: Position Sizing, Stop Loss, Take Profit.
Risk management lies between what you thought of and your final P&L statement. Some of the more common popular sizing formulas are 1% of account equity per trade or fixed fractional based on ATR. An educational template might read:
- Stop-loss -1.5 1/4 ATR (14) long stop-loss ATR.
- Take-profit 2 risk distance (classical 2R).
- Maximum simultaneous positions: One by symbol.
These figures need to fit into your psychological comfort zone. On spreadsheets, a risk of 3 percent of any trade is heroic, but on the live side, it is cruel. NFT traders sometimes cap risk per collection by limiting how many pieces they hold relative to average daily volume, because slippage on a 10 ETH pixel-cat can dwarf any textbook ATR calculation.
Note: Stop-loss orders are not guaranteed; guaranteed stop-loss features, where offered, usually incur additional fees.
Carrying out the First Test Cycle
When you have rules, you can now begin feeding them into your demo account strategy tester. To trade real-life market time in the dummy account with the orders recorded on the platform, you can just forward-test. Any of the two approaches is fine, but it is important to have uniform implementation.
Documenting Each Test Trade
A trade log is a fine piece of information that converts raw data into knowledge. Include:
- Ticket ID, date and time.
- Instrument and timeframe.
- Screenshots of setup (unnecessary but informative).
- Target prices, entry, stop.
- Win/loss and R-multiple.
CSVs are exported in most of the platforms and can be imported into Excel or Google Sheets. Add some notes columns, including news releases nearby? or Friday afternoon liquidity. When the qualitative comments are placed beside quantitative data, there is usually an emergence of patterns. In NFT testing, include columns for on-chain gas fees and royalty percentages, both of which erode net R multiples yet are invisible on traditional price charts.
Assessing Key Performance Metrics
Win rate is the only thing that many traders are obsessed with. Do not give in to that temptation. There are three measures of health of a system:
Expectancy. Average gained or lost per trade. Formula: (\text{Win Prob} \times \text{Avg Win}) - (\text{Loss Prob} \times \text{Avg Loss})$.
Maximum drawdown. Stereotype decrease. Discloses emotional areas of stress.
R-multiple distribution. Demonstrates whether returns are large owing to a handful of home runs or a trickle of 1R wins.
A second cycle should then be done in case of expectancy is positive and drawdown matches your tolerance. Otherwise, diagnose and fine-tune.
Making Sense of Results Without Emotional Bias
Raw numbers can mislead. The plan that has been trained on six weeks of the bull-market crypto data can seem invulnerable until volatility kills and liquidity skews out. Guardrails:
- Sample size. These are intraday systems that must make at least 50 trades and swing strategies that should make 20.
- Market regimes. Add sideway, trending and volatile stages.
- Outlier isolation. Find out how P&L would be different with the removal of the one largest win and the largest loss. Without one blockbuster trade, a system can fall apart.
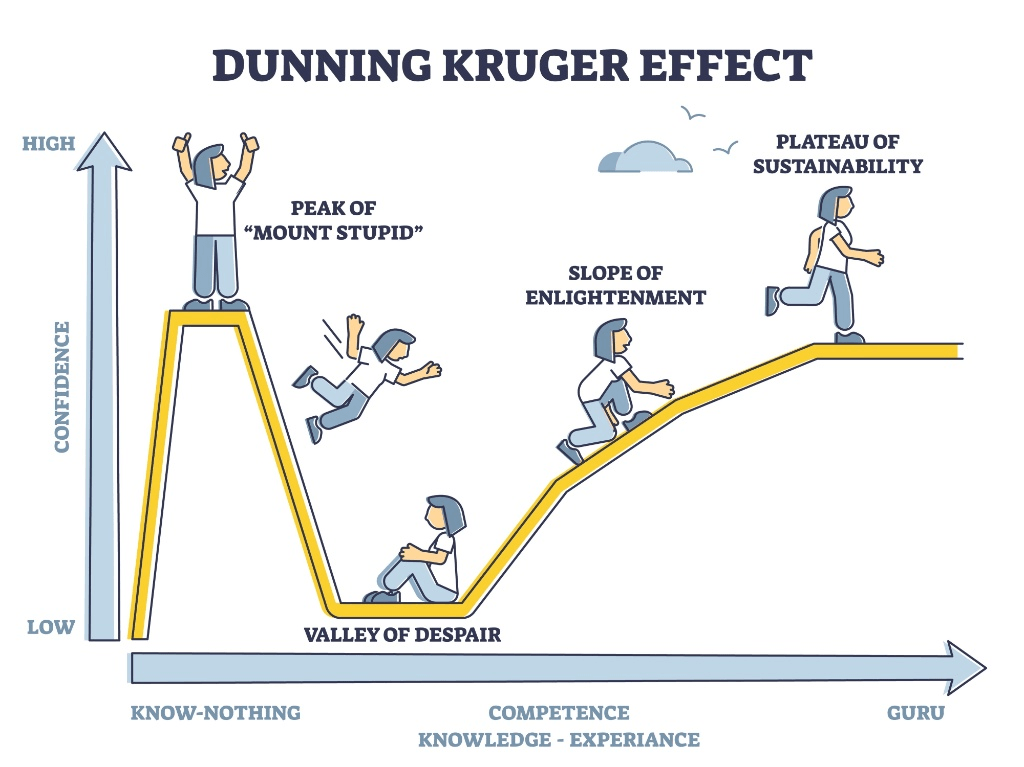
According to market data, 2025-2026, nearly 85% of failed retail accounts adhere to some pattern of behavior. They begin to be cautiously successful, and thus they feel too confident and fail to adhere to disciplined strategies before their first big failure. Due to this, approximately 40 percent of new traders drop out in the first month, and 80 percent of new traders drop out within two years.
Detection of Noise Versus Potential Signal
The chance causes hot and cold spells. Monte Carlo re-sample your trade list: Monte Carlo resample your trade list and track the worst and best equity curves.If a real curve sits inside that envelope while still trending upward, the performance may stem from method rather than luck. Most demo platforms do not include Monte Carlo, but free tools like Python’s numpy.random.choice can handle it in minutes. If programming is not your forte, online simulators work as well; just load your CSV. Web3-native analysts are starting to run similar simulations on wallet-activity graphs, shuffling sale sequences to prove whether a “rare-trait momentum” thesis is more than random noise.
Iteration and Progressive Refinement
Hardly ever does Version 1 fly with feathers. Perhaps the stop-losses are too narrow, or the filter of the higher time-period is unnecessary. Change one variable at a time to isolate effect. Some traders examine:
- Trade management. Try trailing stop vs. fixed target.
- Time filter. Eliminate low-volume hours or Fridays.
- Risk adjustment. 0.5 percent. vs. 1 percent per trade.
Record every change in metadata of the log in order to be able to compare cycles to cycles. Through repeated steps, you will observe that you approach some stable set of parameters or your initial notion of the core idea is edge-free. That is a painful truth but it is less expensive than having to know it alive. NFT iterators might test whether listing slightly below the floor accelerates turnover enough to offset lower gross R, or whether delayed reveals create asymmetric upside worth the elevated rug risk.
From Simulation to Live Conditions
Positive backtest does not translate to success tomorrow, but at some stage, the sandbox postpones growth. Following a checklist:
- Statistical proof. Minimum 100 intraday and 30 swing trades, two market regimes.
- Psychological rehearsal. You did not cheat in any of the rules in the demo.
- Plan of risk sizing. Your dollar risk per trade and heat of entire portfolio is known.
- Contingency procedures. What if the internet goes down? What if slippage doubles?
Some participants start with micro-lots, fractional shares, or reduced-size futures contracts, treating the first quarter of live trading as an extension of testing before scaling up. On the NFT side, many traders simulate an initial go-live by listing a handful of low-tier pieces from the collection to test real-world fill speed and royalty slippage before deploying larger capital into grail items.
Final Thoughts
The process of backtesting via a well-organized demo trading session is a less glamorous way of investing in the new meme stock, but it is as close to an insurance policy as retail traders have ever got. You transform abstract theory to a fact and polish every point of entry and exit with no money pain and train the muscle memory to execute in a disciplined manner.
By 2026, there is no predictable market anymore - AI-enhanced liquidity, geopolitical shocks, and flash crashes are the order of the day. Even so, systematic preparation can help traders remain process-focused rather than prediction-focused. According to the latest reports by the Bank for International Settlements (BIS), technological progress, in particular in the area of Artificial Intelligence (AI) and tokenization, has ensured that individual traders can now more easily enter the market due to the presence of sophisticated analytical tools hitherto available to the institutional participants. The BIS, however, declares that this "democratization" is more likely to contribute to the herd behavior and the volatility of the market. The tools themselves confer no edge; disciplined methodology decides the outcome. NFT markets epitomize that tension: frictionless minting lowers entry barriers, but only a tested process turns a flood of new collections into a measurable opportunity instead of noise.
Summary
This article is not compliant in its current form for an SCB website article. The biggest issues are the missing risk warning/disclaimers, the heavy use of step-by-step trading guidance, and the promotional/confidence-building language. It also includes unsourced factual claims about CFA Institute, trader failure/dropout rates, and BIS, while failing to clearly explain that CFDs are high-risk derivative products that may not be suitable for all investors. SCB’s site currently shows its legislative framework under the Securities Industry Act, 2024 and continues to list Contracts for Differences Rules, 2020, so the regulatory context remains active and relevant.
Main compliant point:
The piece does not contain testimonials, visuals, or explicit asset-price forecasts.
Final recommendations:
Rework this into a neutral educational explainer. Remove specific strategy parameters, entry/exit examples, sizing rules, “graduate to live” guidance, and action-led CTAs. Add the correct risk warning, the marketing communication / not investment advice disclaimer, and the stop-loss disclaimer if stop losses remain. Clarify that CFDs are derivative products, involve leverage, and may not be suitable for all investors. Source or remove all third-party/statistical references.